 AppRank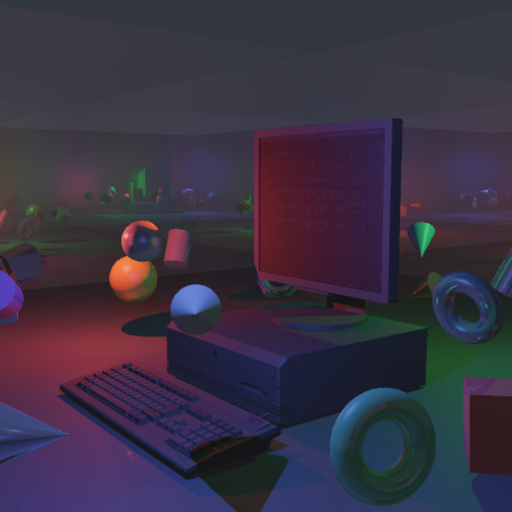
Description
Little benchmark application for Apple Silicon and Metal/Vulkan. NerdBench puts your Mac's GPU and CPU through real rendering and compute work – ray tracing, path tracing, rasterization and matrix maths – on Metal, Vulkan and the CPU, so you can compare them side by side and see where the performance comes from. THE TESTS Compute • SGEMM – single-precision matrix multiply, in GFLOP/s • Matrix Transform 4×4 and Matrix Chain 4×4 – the vertex and hierarchy maths behind every 3D engine • Vector Math ALU – normalize, dot, cross, reflect and FMA at full load • Memory Bandwidth – streaming reads and writes over a large buffer, in GB/s • Parallel Reduction – tree reduction through threadgroup memory Rasterization • A textured, lit 3D scene of more than 134,000 triangles, at up to 3840×2160 • Fillrate / Overdraw – heavy blended overdraw, in GPix/s Ray tracing and path tracing • Each in two versions: software BVH traversal that runs on all three backends, and Metal ray tracing with acceleration structures refitted every frame, using the dedicated ray tracing hardware on M3 and later • The path tracer computes Monte Carlo global illumination: diffuse bounces, GGX metals, clear and frosted glass with refraction, emissive surfaces and sky light. There is no denoiser – every sample is really traced. THE SCENE A detailed 1990s desktop computer stands in a mirrored room. Three colored lights orbit it while twenty-five glass, plastic, metal and copper objects drift and spin the other way, and the camera circles the room. Turn the animation off and the path tracer refines a still image sample by sample, right in front of you. THREE BACKENDS, ONE WORKLOAD • Metal – the Mac's native graphics API • Vulkan – through MoltenVK, to compare a portable API with Metal on the same GPU • CPU – multithreaded NEON code with a software rasteriser and the same ray and path tracers, on as many cores as you choose All three share the same algorithms, shading and scoring, so a result on one compares directly with the others. Every test runs on every backend, except the two that need Metal ray tracing. HONEST NUMBERS • GPU time and end-to-end time for every test, so CPU-side overhead is shown rather than hidden • Average, minimum and 1% low frame times, and the number of iterations measured • GPU timestamps that cannot be right are discarded, and the run tells you when that happens • An overall index: the geometric mean of every test that passed YOU'RE IN CONTROL • Pick any set of tests, and set the measure window, warm-up and matrix size • Raster resolution up to 3840×2160, ray and path tracing up to 1920×1080 • 1 to 1024 samples per pixel and up to 32 bounces • Ray-traced shadows, animation and live preview, each on or off • A live preview of the rendering tests and a frame-time graph • Export results as JSON or CSV • A command-line mode for scripted runs PRIVATE BY DESIGN NerdBench has no account and makes no network connections: no analytics, no ads, no tracking. Results stay in the app until you export them. For repeatable results, connect the power adapter, turn off Low Power Mode and quit other apps before a run. Amiga 4000D object from: https://3dwarehouse.sketchup.com/model/032de160-6e4d-46df-b41c-258f2582fb1e/Commodore-Amiga-4000D Author of object: Sebastien G. Full version with memory, AI operation and CPU speed tests.
Information
- Seller
- Dariusz Wisniewski
- Category
- Utilities
- Version
- 1.0
- Requires
- iOS 14.0+
- Size
- 20.9 MB
- Age Rating
- 4+